(DI-2205) Display KPIs
Prerequisites
Systems and servers are displayed only if you added them to CrystalBridge® Monitoring. How to add a system is described in the chapter (DI-2205) Add a New System
Display a KPI in a chart
To display a KPI, select a particular system and a server in System landscape and specify a time interval.
The default and custom KPIs are displayed on the left, under KPI groups. KPIs and KPI groups can have an active or inactive (grey) status.
- active KPIs – KPIs are monitored for the selected systems and in the selected time interval.
inactive KPIs – KPIs aren't monitored for the selected systems and servers and in a selected time interval. The inactive KPIs aren't displayed in KPI charts.
More information on how to start the monitoring of a KPI in a specific time interval can be found in the chapter (DI-2205) Schedule the Monitoring of KPIs
If the inactive KPIs aren't visible in KPI groups, you may display them by selecting Settings > User settings and clearing the checkboxes Hide unused KPI from KPI groups and Hide unused KPI groups.
More information about user settings can be found in the chapter (DI-2205) User Display Settings.- Choose a KPI in KPI groups and select the KPI charts tab.
You can either search for the KPI:- by entering a keyword or a technical name of a KPI into the search field (The search field is marked red in the figure below).
or - you may filter the KPI by selecting Filter and entering its technical name.
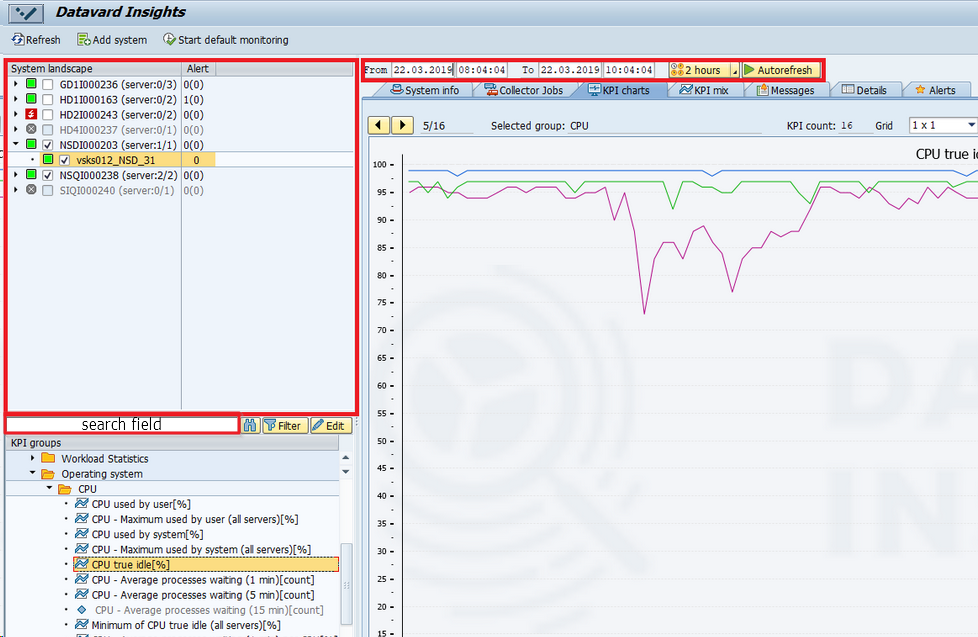
- by entering a keyword or a technical name of a KPI into the search field (The search field is marked red in the figure below).
KPI charts
Please check all information about KPI charts in the chapter (DI-2205) KPI Chart Description.
Limits for displaying data
The amount of data loaded and displayed in charts on a page has limits. The limits aren't determined by application server resources, but by resources (mostly memory) on the fronted PC. In general, it shouldn't cause an error to display 16 KPIs (grid 4x4) with data from 1 system and all its servers for a 1 month time period.
In the case the amount of data reaches its limits, the charts aren't refreshed and the following pop-up appears.
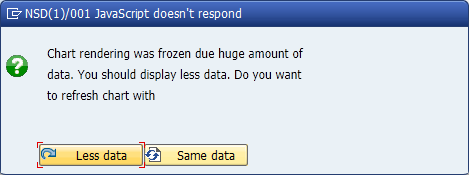 Pop-up when charts are frozen
- If you click Less data, the system refreshes the screen and displays only one KPI chart (grid 1x1) for the selected systems and time period.
- If you click Same data, the system tries to refresh the screen with the existing selection. If the refresh with the same data leads again to screen freeze, then the pop-up is displayed again.
Display a list of all KPIs
There are two possibilities of how to display a list of all default and custom KPIs.
- The first option is to display KPIs on the main screen in KPI groups. In this view, it is not possible to edit custom KPIs and to distinguish between a custom and default KPI.
- In the second view, you may distinguish the custom KPIs (their technical name starts with a capital Y or Z) from the default KPIs. Additionally, you may edit the settings of custom KPIs.
To display this list go to Settings > Monitoring Settings (transaction /DVD/MON_CUST) and click KPI definitions.