(DI-2205) User Display Settings
You can set up your own CrystalBridge® Monitoring GUI by selecting Settings > User settings. In the next screen, you may adjust General display settings or the Display settings of KPI charts.
Adjust the general display settings
Select General, check the checkboxes explained below based on your preference and save  (F8).
(F8).
Display full system ID
This setting allows you to display a full system ID in 10 characters.
Ping system on refresh
With every refresh of CrystalBridge® Monitoring, the functionality tests the connection to each monitored system.
This option may slow down the response of GUI, as all connections are tested.
Ping application server on refresh
Similar to ping system on refresh by every refresh of CrystalBridge® Monitoring, the system tests the connection to every application server.
This option may slow down the response of GUI, as all connections are tested.
Set last time interval on startup
The functionality always saves the last specified time interval before closing CrystalBridge® Monitoring and uses it when relaunching CrystalBridge® Monitoring.
Don't use the user's local time zone
All-time fields in CrystalBridge® Monitoring are displayed in the time zone of the central system.
Hide unused KPI from KPI groups/ Hide unused KPI groups
All inactive KPIs or KPI groups are hidden from the KPI groups tree.
Hide not collected detail tables
By default, this setting is checked to display only collected detail tables in the (DI-2205) Working Tabs tab. You might adjust this setting to display all available detail tables (collected detail tables with those which are not collected).
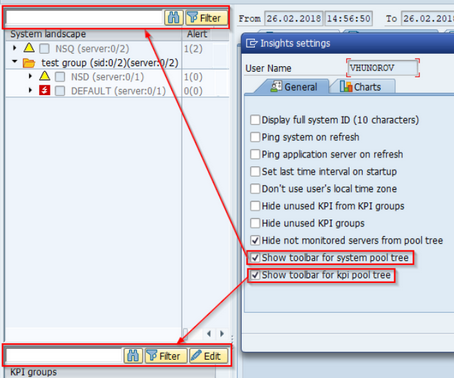
Hide non-monitored servers from pool tree
All servers which are marked as Don't monitor in System settings are hidden in System landscape.
Search toolbar for System pool tree and KPI pool tree
The two search bars for System landscape and KPI tree enable you to navigate to a folder of the tree by entering its description or name (for example, if you fill in the KPI "CPU" and all the KPIs that include CPU within their name are displayed).
By default; the search bar for the System landscape is hidden.
Quick search for SIDs, Servers, KPIs
Adjust the display settings of KPI charts
Select Charts, check the below-described checkboxes based on your preference and save (F8).
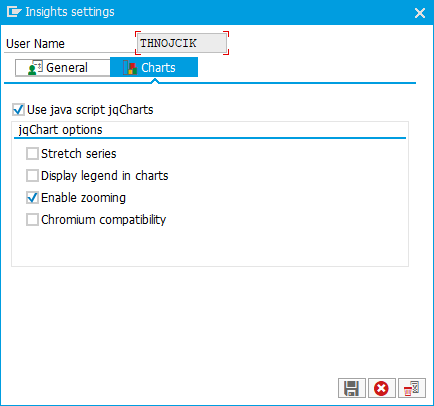
Use JavaScript jqCharts - Enables you to display charts implemented by Java Script. Charts in Java Script allow you to do more interactive actions as described below. They also display faster huge amounts of data in charts.
If you enable charts, which are implemented through Java Scripts, you may also select among these actions:
- Stretch series - All displayed charts are stretched to the selected time intervals.
- Display legend in charts - A legend is displayed in all charts.
- Enable zooming - Enables you to zoom in and zoom out in a chart.
- Chromium compatibility - It is recommended to select this flag when a Chromium-based browser is used. Otherwise, the jqCharts may not work properly and throw error "Problem:$ not defined" when drawing a chart.
All settings are saved for a particular user and are restored in the next run of CrystalBridge® Monitoring.
If the saved settings are no longer suitable, then click Reset to default settings  (F2).
(F2).