(DI-2205) Display Several KPIs in KPI Mix Chart
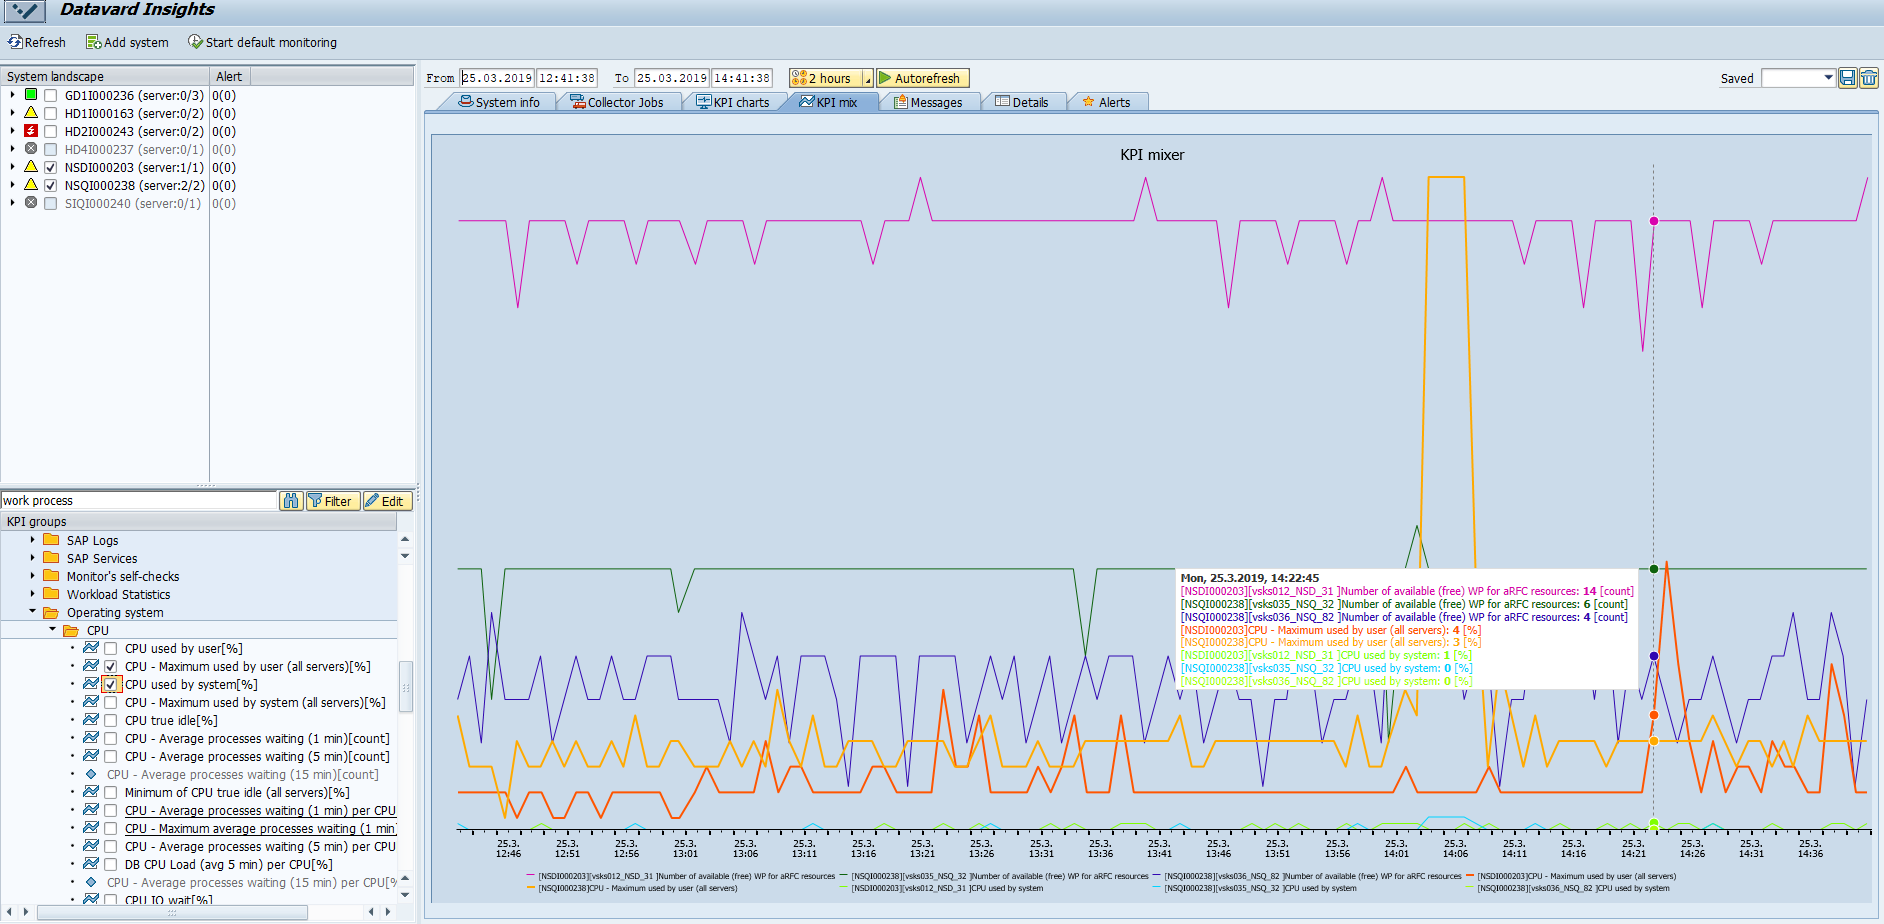
In the KPI mix tab, you can see the behavior of more KPIs together in one chart. You can graphically compare dependencies between different KPI values for the selected time period.
More than that, you may display KPIs which correlate with the source KPI, as described in the section Find correlated KPIs.
For more information about how to display one KPI value in a chart and about general settings that are necessary to display a KPI, see the chapter (DI-2205) Display KPIs.
To display the KPI series in a chart
- Select systems or servers in System landscape and set a time interval.
- Select KPIs in the KPI groups tree. You can select only active KPIs which include a checkbox. Inactive KPIs can't be selected, as their values weren't collected for the specified time period or the selected system.
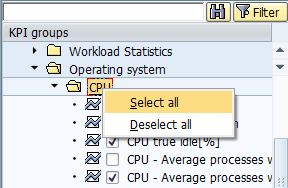
You might also use the Select all or Deselect all option, which is accessible by selecting of the KPI group name from the context menu (see the figure below)
Selected KPI is displayed as a new colored KPI series in a chart.
Find correlated KPIs
KPI mix is mainly used for finding and displaying KPIs which correlate with the source KPI. The correlation functionality calculates the correlation coefficients for all KPIs, which have the same period of the collection (e.g., 5 min) and have at least two collected values in the specified time period. Correlation coefficients contain values from the interval < -1;1 >. The closer is the absolute value of the coefficient to 1, the more the KPI correlates with the source KPI.
By default, only the first twenty KPIs which have the coefficient greater then 0.7, are displayed.
If the system doesn't find any correlating KPI, then only the selected KPI is displayed in the KPI mix chart.
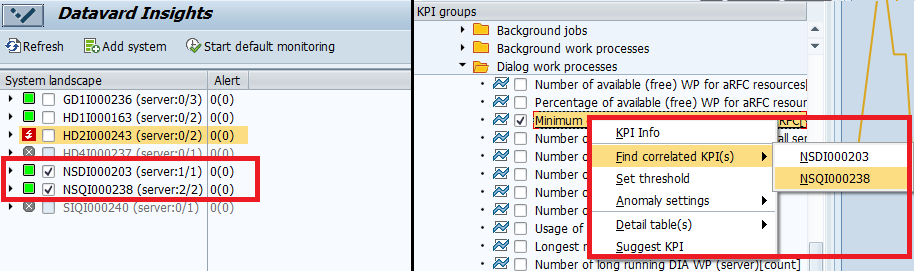
To find correlated KPIs
- In the context menu choose any active KPI in KPI groups and select the option Find correlated KPI(s).
- A sub-menu includes systems or servers based on your selection in System landscape. The content of the sub-menu depends on whether the selected KPI is defined as a system or server KPI.
- Select one system or server.
- The correlation functionality is executed and the list of all found correlating KPIs is displayed in the KPI mix chart.