(DI-2205) Wizard for KPI Creation based on SQL Statement
There is a possibility to create a new custom KPI based on the SQL statement with a Wizard for a KPI. Wizard enables you to:
- Create a Custom KPI Definition with its long description
- Assign the Monitoring profile and KPI group
- Define SQL statement for KPI calculation
- Define SQL statement for KPI details (OPTIONAL)
- Schedule the Collector job for monitoring of the Custom KPI (OPTIONAL)
Above mentioned points are represented as separate screens through which you set up the whole KPI monitoring. Wizard will guide you through these steps and when you confirm the setup, the KPI is ready for monitoring.
KPI Wizard functionality
You can start the KPI Wizard from the KPI Group Context menu > Create custom KPI. Wizard is displayed and you need to go through all its steps.
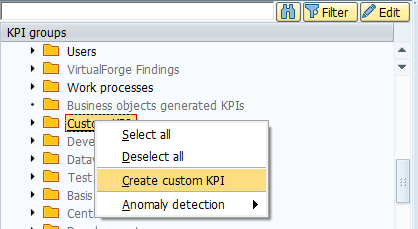
You need to have valid authorizations assigned to create a custom KPI (authorization object /DVD/CCCUS with activity 12 - change customizing/setup). Otherwise, the item 'Create custom KPI' will not be displayed in this context menu.
Wizard steps
Wizard for KPI creation contains several steps. Each step functionality is explained in more detail in the next chapters.
Information only for AppDynamics users
If CrystalBridge® Monitoring is integrated into AppDynamics, then one additional step AppDynamics Mapping is available in the wizard. In this step, you might integrate a new KPI with AppDynamics metrics. 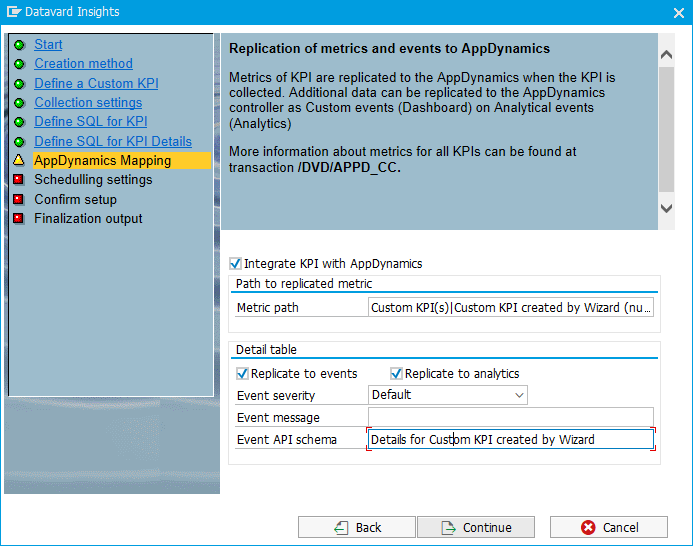
More information about mapping a KPI with the AppDynamics metrics outside of the wizard can be found in the chapter Mapping Between AppDynamics Metrics and CrystalBridge® Monitoring KPIs.
Start
The starting screen of the wizard where a short description of the KPI Wizard purpose is displayed. 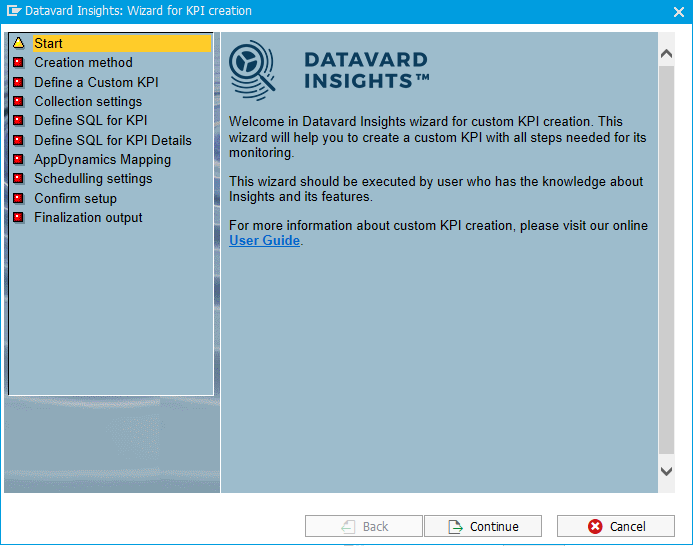
Creation method
This step provides a possibility to choose a method for KPI creation. For now, there is available only a method for KPI creation by SQL statement. The creation of KPI based on SQL statements makes sense only for remote systems. That is the reason why you do not have a chance to change the 'Remote system' and 'System' values.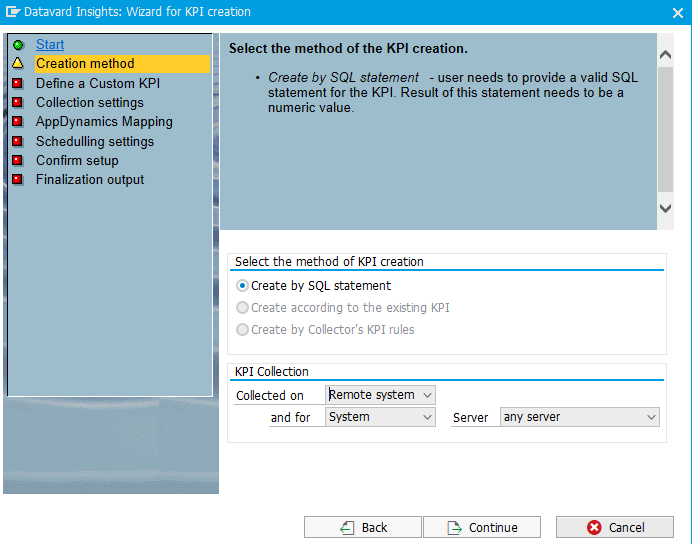
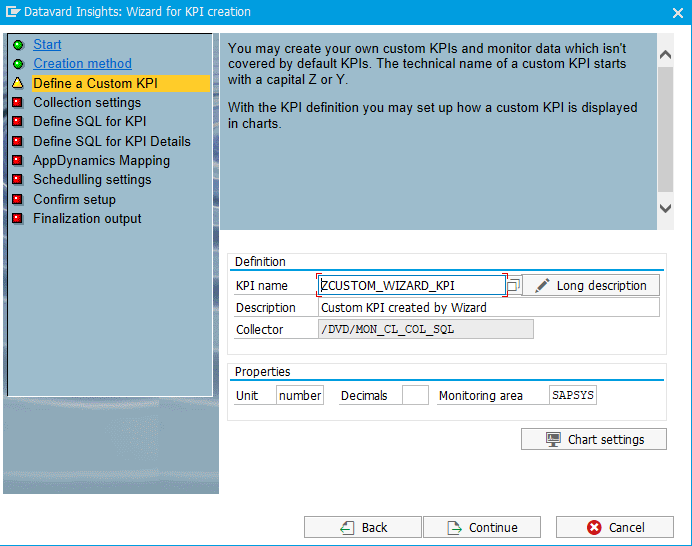
Define a Custom KPI
This screen serves for KPI definition where you need to fill up the following fields:
Definition
- (MANDATORY) KPI name - name of a custom KPI that does not exist on the system. In the case that you will enter the name of the KPI which already exists, the message "KPI .. already exists!" appears.
- (MANDATORY) Description - short description of the KPI which is displayed in the KPI Chart or other outputs as KPI label.
(MANDATORY) Collector - name of the Collector that calculates the KPI. As you define a KPI based on SQL statement, general collector /DVD/MON_CL_COL_SQL is used.
Collector /DVD/MON_CL_COL_SQL is a general collector for calculating the KPIs by their defined SQL statements. More information about this collector can be found in the chapter (DI-2205) Collector for user defined SQL.
Properties
- (RECOMMENDED) Unit - Unit of a measurement which is displayed next to the KPI value in the chart.
- (OPTIONAL) Decimals - Number of decimals which is displayed in charts. An empty field means that no decimals are displayed.
(MANDATORY) Monitoring area - Monitoring area of a system, which is specific for a KPI. A KPI is collected only for specific Monitoring areas, such as SAPSYS, BW, ERP, CRM, SRM, and others. To select a Monitoring area use the search help (F4), which displays only existing Monitoring areas.
If you would like to change the Monitoring area value from 'SAPSYS' to another value, please always check whether this area is assigned to the system on which you would like to monitor this KPI (more information can be found in the chapter (DI-2205) Assign a Monitoring Area to a Satellite System). We recommend using predefined 'SAPSYS' value.
If you define the non-existing Monitoring area, the message "Monitoring area &1 does not exist" is raised. In such a case, you might use the F4 help to display the list of existing Monitoring areas.
Long description (OPTIONAL)
You might set a long description of the KPI by clicking on the Long Description button. A long description of the KPI is displayed in the KPI info pop-up and in the KPI charts.
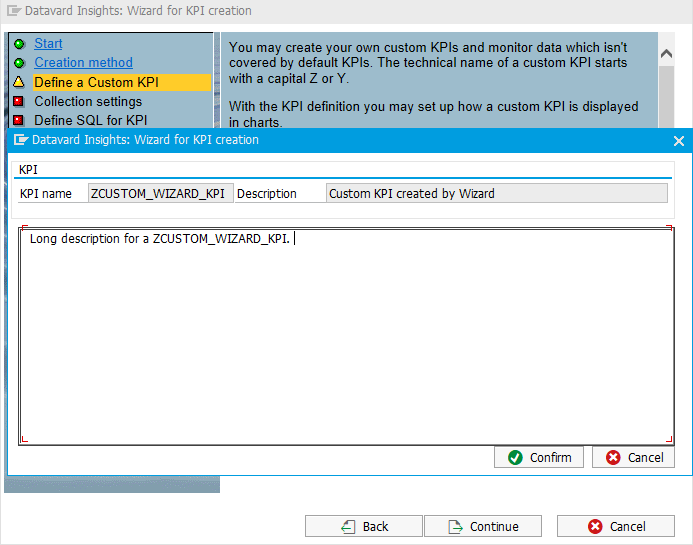
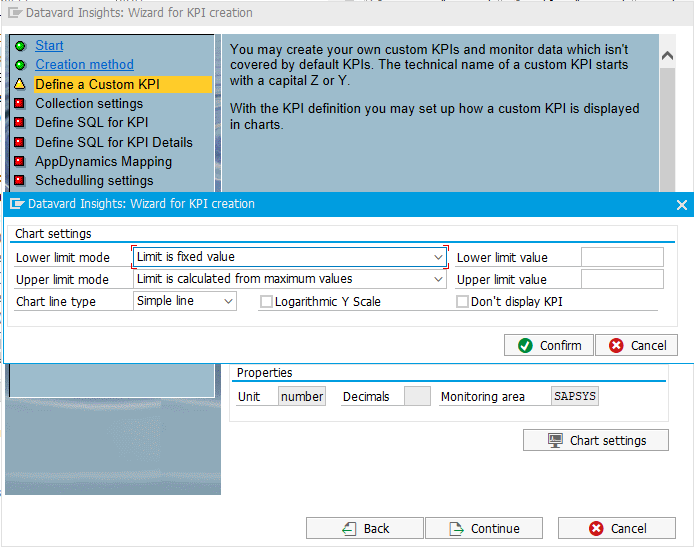
Chart settings (OPTIONAL)
There are predefined values on how to display a KPI in the charts. If you want to change these settings, you might click the Chart settings button to display a popup where you can change the default values.
You may set the lower and upper limits for displaying your KPI chart.
- Lower/Upper limit mode: mode according to which your KPI chart is displayed
- Limit is calculated from minimum/maximum values
- Limit is a fixed value
- Limit is calculated from fixed and minimum/maximum values
- Limit is calculated from minimum/maximum values
- Lower/Upper limit value: value of the selected limit mode, based on which your KPI is displayed in charts
- Chart line type: "Simple line", "Spline line" or "Discrete line"
- Logarithmic Y scale: Y-axis labels are values of the common logarithm (decimal)
- Don't display KPI in charts: by the selected checkbox the KPI isn't displayed in charts or in the KPI group list. For example, you may select this field if you want to use the KPI value for other KPI calculations or aggregations.
Collection settings
In this step, you have to define a monitoring period for the KPI and you can also assign a KPI group under which KPI will be displayed in the KPI tree.
Period
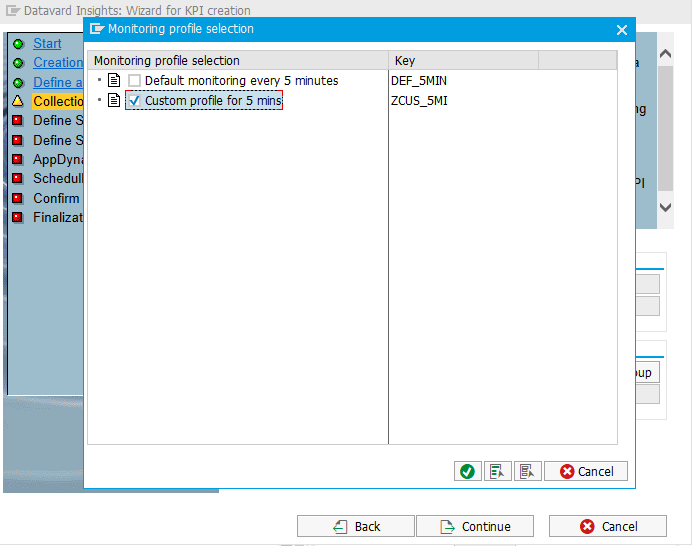
If you define a period for which already exists more than one Monitoring profile with the same period, the selection tree is displayed. You can assign only one Monitoring profile for KPI calculation.
You can modify the description and retention time only for the custom Monitoring profile (technical name starting with Z* or Y*). Default Monitoring profiles can not be changed.
Otherwise, if the Monitoring profile does not exist with the provided period, a new custom Monitoring profile name is generated. It is allowed to generate only custom Monitoring profiles starting with Z* or Y*.
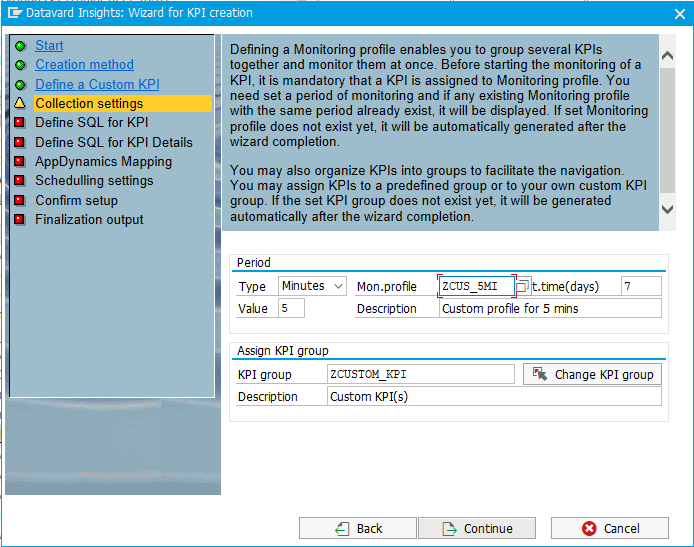
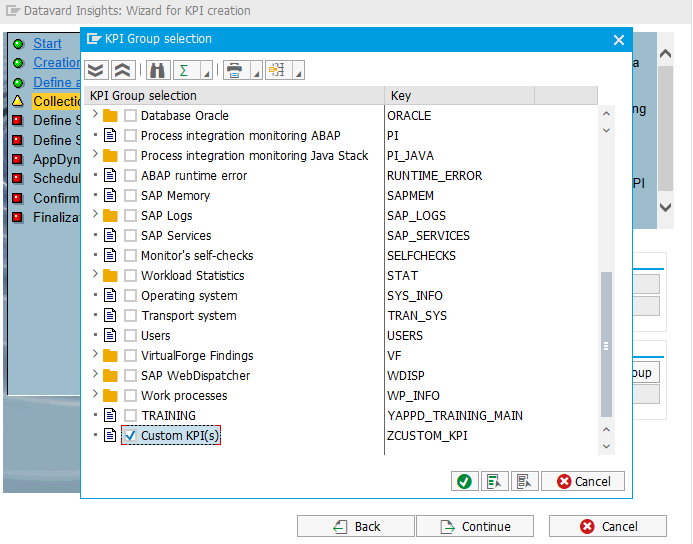
KPI Group
You might assign a different KPI group by clicking on the Change KPI group button. KPI Group selection tree is displayed and you must select only one KPI group from the tree.
By default, the predefined KPI group is detected by the group selected when calling the KPI Group Context menu when starting the wizard. It is not allowed to change description of existing KPI group. If you fill in the name of the KPI group which does not exist, you need to specify also its description and it will be automatically created at the end of the wizard.
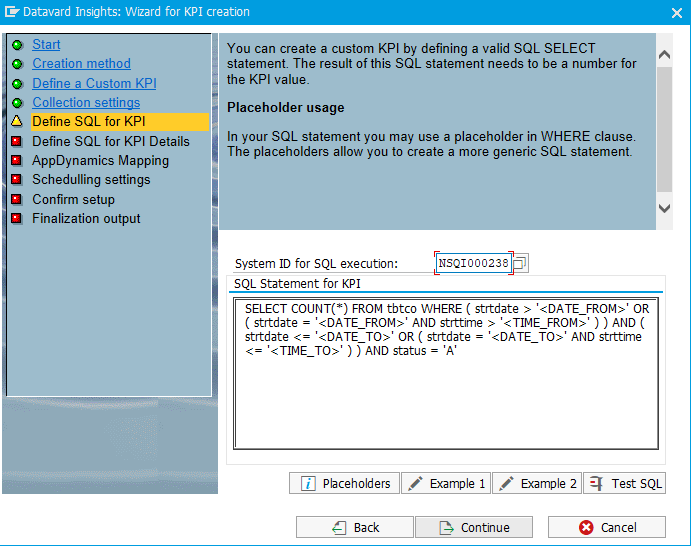
Define SQL for KPI
You need to provide a valid SQL statement for KPI calculation. Please keep in mind that this SQL statement needs to return a number value. At this screen are available also two examples of how to define a valid SQL statement:
Example 1 - provides SQL statement which calculates the number of locked system users.
Example 2 - provides SQL statement which calculates the number of canceled BTC jobs from the last run. This example contains also the usage of placeholders.
The list of available placeholders can be displayed by clicking on the Placeholders button or you might find additional details in the section (DI-2205) How to Create a KPI Through Defining a SQL SELECT Statement.
If you want to execute provided SQL statement on any remote SAP system defined in Crystal Bridge Monitoring, you might change the value in field System ID for SQL execution. By Test SQL button, you can check whether provided SQL statement is valid for the SAP system defined in the field System ID for SQL execution.
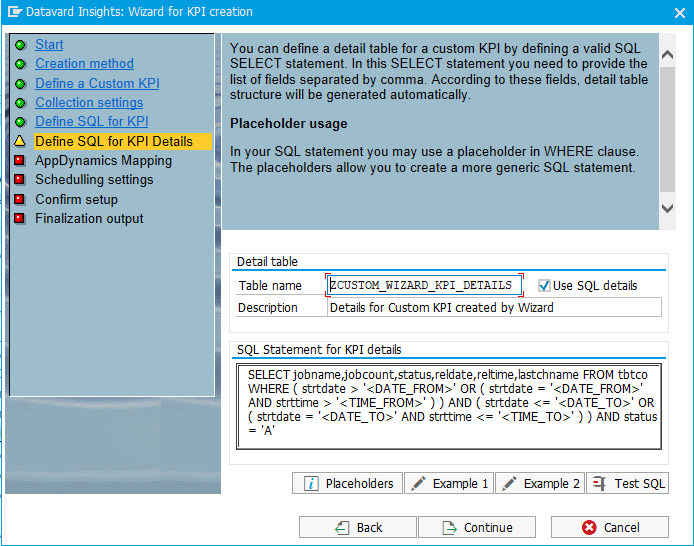
Define SQL for KPI details (OPTIONAL)
By default, the collection of KPI details is disabled. If you want to collect KPI details, you need to check the Use SQL details checkbox. A technical name of the detail table is generated with its description, but you can modify it. Please make sure that set detail table name does not exist yet.
The second step is to define SQL statements to collect KPI details. In this SQL statement, you need to manually enumerate the list of fields separated by a comma. As in the previous step, two examples are available for SQL statements for KPI details collection.
You might find more information about placeholders for the detail table in the section (DI-2205) Create a Detail Table for a Custom KPI Assigned to the Collector for a User Defined SQL.
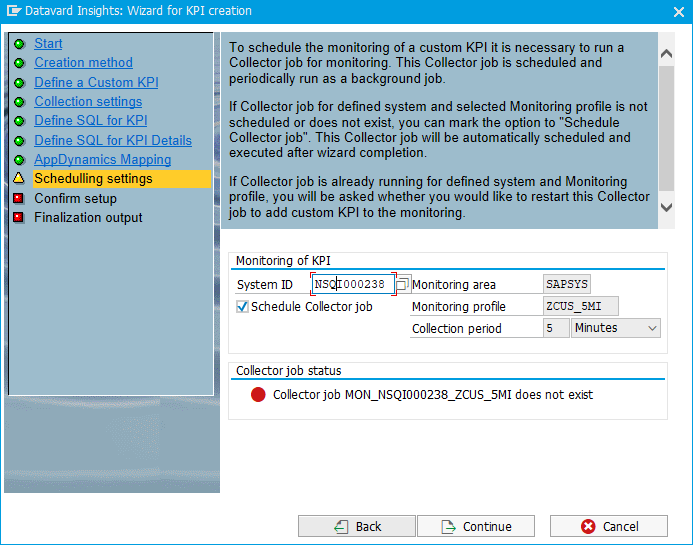
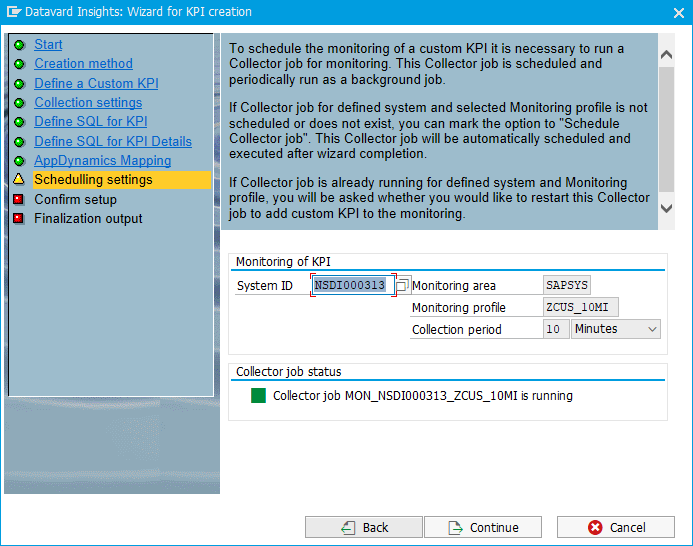
Scheduling settings
You have the possibility to schedule a Collector job for KPI monitoring directly through the wizard. The wizard checks whether the Collector job for provided Monitoring profile and System ID is already running or not. There can be multiple scenarios:
- Collector job does not exist - message "Collector job ... does not exist" appears. You might mark the Schedule collector job as checked to create and start a new Collector job
- Collector job is not scheduled - message "Collector job ... is not scheduled" appears. You might mark the Schedule collector job as checked to start the existing Collector job.
- Collector job is running - message "Collector job ... is running". In this scenario, you will not see the Schedule collector job option.
- Collector job is paused - message "Collector job ... is paused". You might mark the Schedule collector job as checked to start (resume) the existing Collector job.
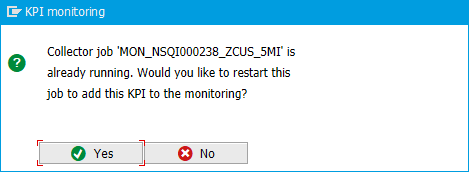
When the Collector job is already running, in the next step you will be prompted to confirm whether you would like to restart the Collector job and add a new KPI to the monitoring. Restart the collector job to start the monitoring of KPI immediately.
If a previously defined Monitoring area is not assigned for entered System ID, the error message "Monitoring area ‘&1’ is not assigned to the system '&2" is displayed. In case that invalid Monitoring area is defined, you can change the value directly in the field Monitoring area (input help will display only Monitoring areas assigned to the entered System ID). If everything is set correctly, the field Monitoring area is not editable.
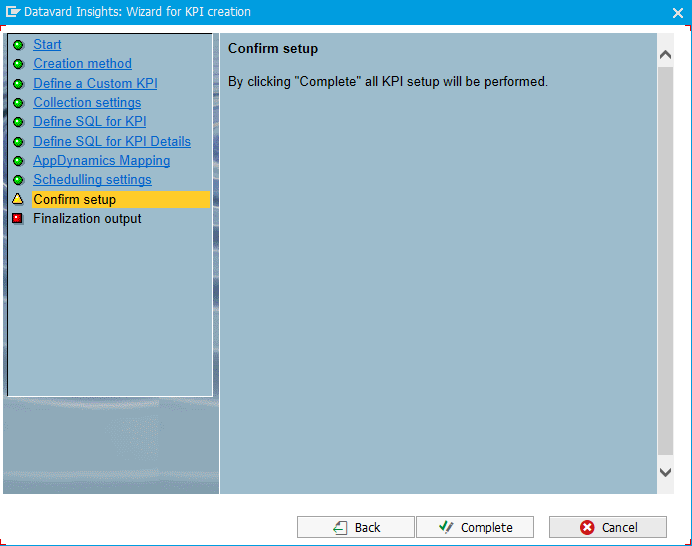
Confirm setup
This step serves as a confirmation of the custom KPI setup. All provided setup is saved after clicking on the Complete button.
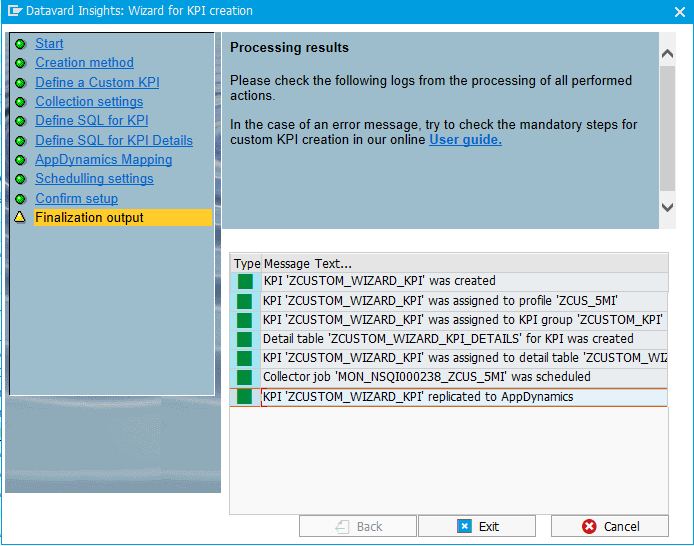
Finalization output
Last step of the wizard. On the screen below you can see the output as the result of the KPI setup.