(DI-2205) Alert Definition
3. The third option is to define alerts in monitoring customizing by selecting Alerts and defining the bellow mentioned fields.
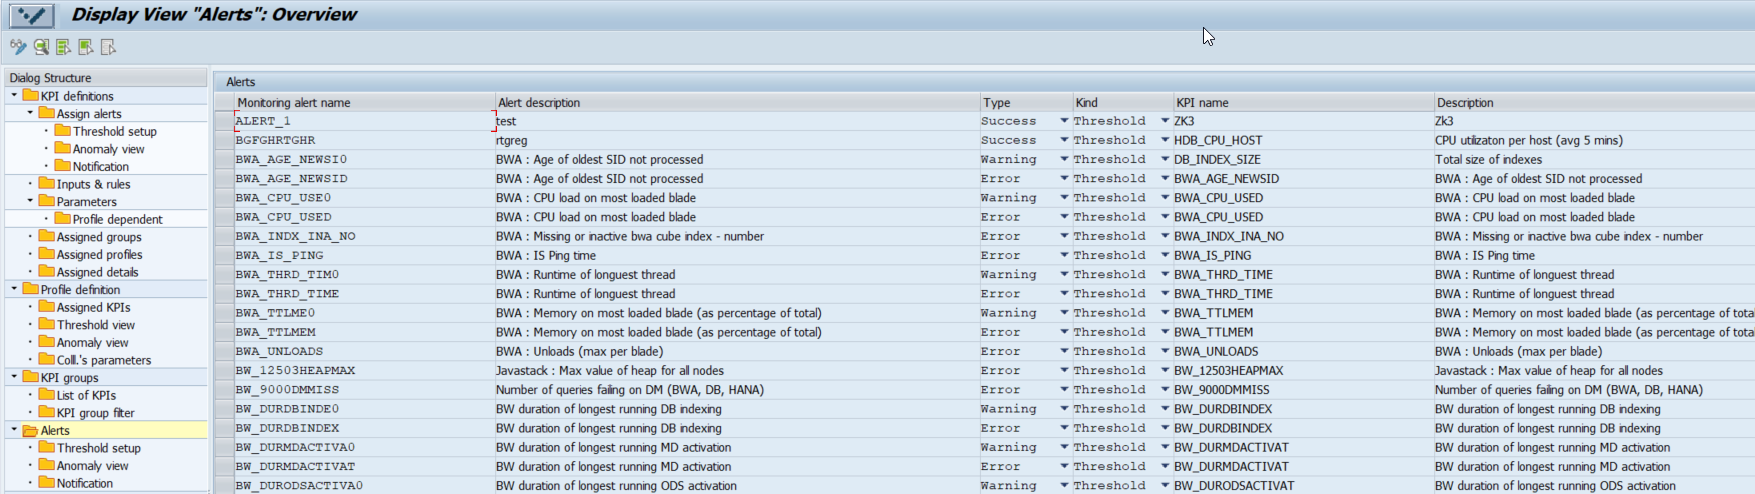
Alert view
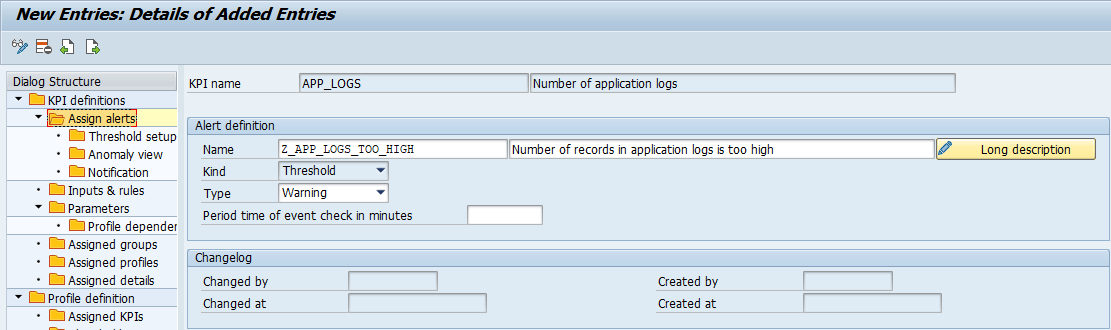
This definition consists of:
- Alert name – a unique, case-sensitive technical name of an alert.
Please note that you can create or modify only field names (in this case the alert name) that start with Z*, Y* (or X* for generated Alert name). The standard customizing (field entries except the ones starting with Z*, Y*, X*) can not be changed or added. - Alert description – the description is used as the label in outputs.
- KPI name and description – name of a KPI for which an alert is created.
- Alert type – describes the type of alert and determines the icon to be displayed if the alert occurs. Possible values are:
- Success –

- Warning –

- Issues –

- Error -

- Success –
- Period time – the frequency that specifies how often the alert is rechecked.
- Changelog – displays the user name and time, when the alert was created and changed.
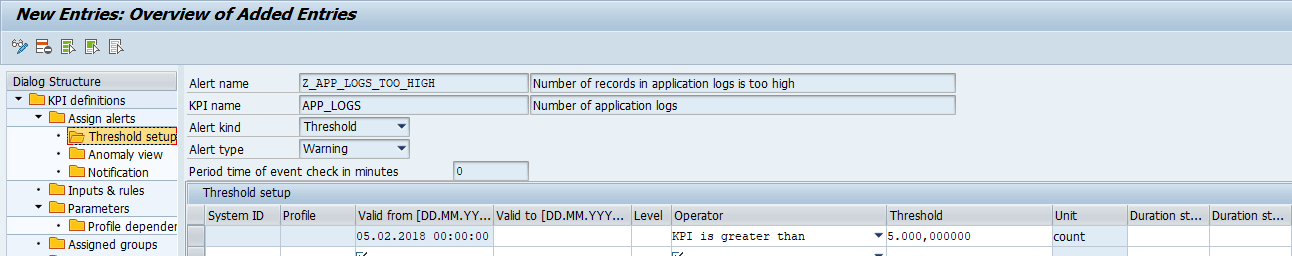
For every alert created, it is necessary to define associations to the KPI and to the Profile. This can be done in the Threshold setup category of this screen, according to the type of alert.
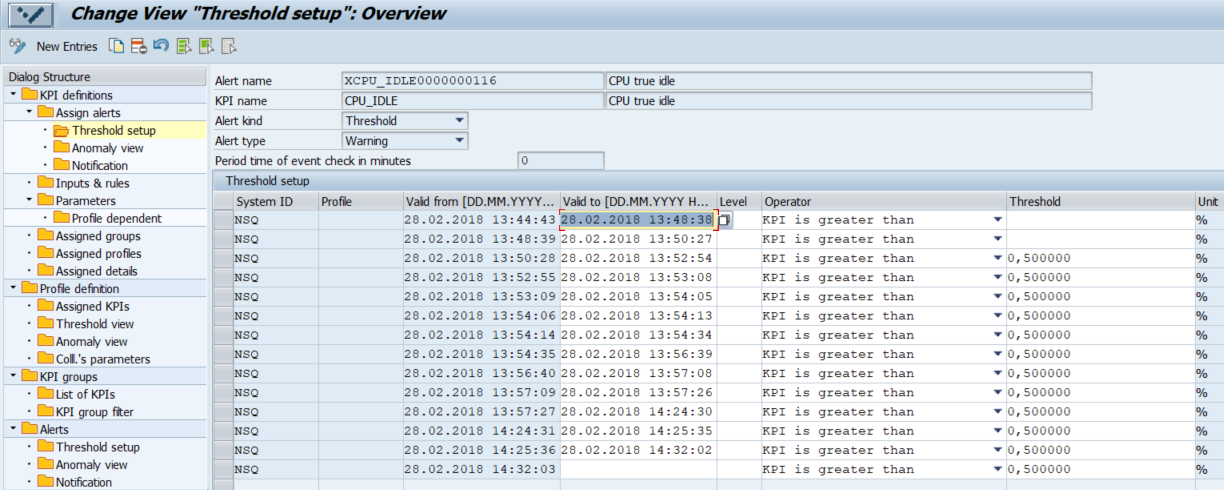
Threshold setup
The following fields should be filled:
- Monitoring profile – alert will be checked only for this profile under running Collector job.
- KPI name – alert will be checked only for the value of this KPI.
- Comparison operator – determines in which case a KPI value causes an alert to occur.
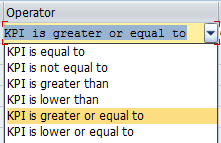
Comparison operator
- Threshold – determines the limit value for a KPI. This alert will occur if the KPI exceeds its defined threshold of associated alert.
- Unit – determines the unit of measurement to be used, i.e., %, MB, etc.
- Duration start – how long can a KPI value exceed the threshold (in the grey area) before an alert will occur (starting delay for the alert).
- Duration end – how long a KPI value has to be outside of the threshold area (in the grey area) before an alert will be stopped (ending delay for the alert).
Threshold setup
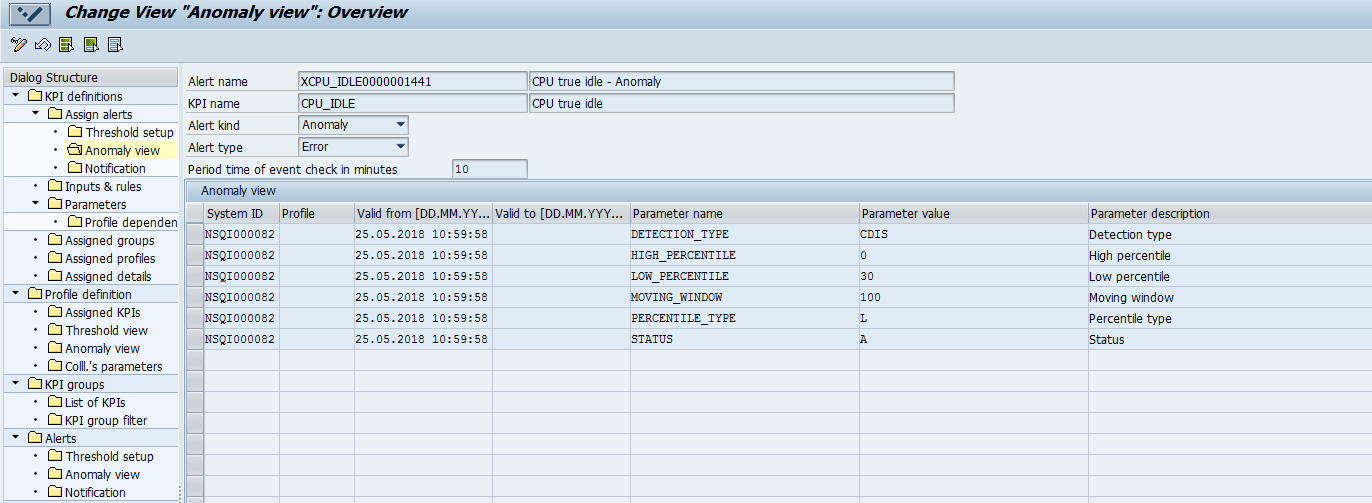
Anomaly view
This view serves only to display existing anomaly alert settings. It's not possible to create a new setting for anomaly alerts. In case you want to create a new setting or change the existing one, you need to use the context menu for KPI in the Monitor cockpit.
- System ID – alert will be checked only for this system under running Collector job. In case this field is empty, an alert will be checked for all systems.
- Monitoring profile – alert will be checked only for this profile under running Collector job. In case this field is empty, an alert will be checked for all profiles under running Collector jobs.
- Parameter name – defines a name of a setting that is used in anomaly detection. Each anomaly alert consists of the following settings:
- Detection type – specifies a method for anomaly detection
- High percentile – defines a value of high percentile which is used in anomaly detection calculation method
- Low percentile – defines a value of low percentile which is used in anomaly detection calculation method
- Moving window – defines a value of how many KPI values in the history should be included in the anomaly detection calculation method
- Percentile type – defines which KPI values will be excluded from the anomaly detection calculation method
- L (Low) – only those KPI values will be excluded which are less than a value of low percentile in analyzed KPI values
- H (High) – only those KPI values will be excluded which are higher than a value of high percentile in analyzed KPI values
- M (Low + High) – subtraction of high and low percentile values. In this case, the IQR method for anomaly detection is used.
- Status - specifies a status of settings for anomaly detection
- A (Active) – anomaly detection is enabled when the Collector job is running
- W (Waiting) – anomaly detection is enabled when the Collector job is running, but there are not enough KPI values collected yet. The number of collected KPI values is less than the size of the moving window.
- C (Closed) – anomaly detection is disabled
- S (Simulation) – these settings were created when the simulation of anomaly detection on historical KPI values was executed.
- Parameter value – defines a value that is used in the anomaly detection calculation method
-
Anomaly view
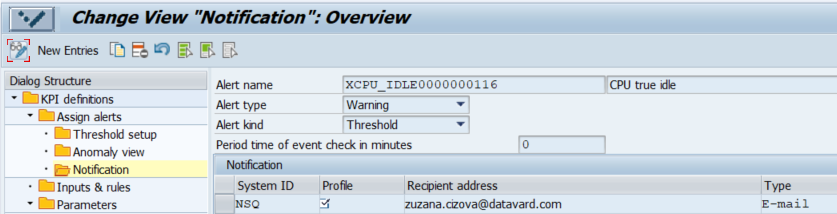
Notification
Each alert occurrence can be notified by email or by message in SAP Business Workplace. That can be done in the Alert notification category of this screen. The following fields should be filled in:
- Monitoring profile
- Recipient address – the email address or the username from the SAP system can be specified.
- Type of notification – determines the notification method. Possible values are:
- E-mail – notification will be sent to the email specified in the "Recipient address" field.
- SAP Office message – notification will be sent to the SAP Business Workplace for the user who is specified in the "Recipient address" field.
- Private distribution list – notification will be sent to all addresses defined in SAP Private Distribution List (transaction SO15 or button "Distribution list" in CrystalBridge® Monitoring toolbar).
- Shared distribution list – notification will be sent to all addresses defined in SAP Private Distribution List (transaction SO15 or button "Distribution list" in CrystalBridge® Monitoring toolbar).
- BAdI ID – [optional] ID, which will be used for filtering of BAdI call. You can create your own BAdI for notification using BAdI implementation /DVD/MON_BADI_DEF_EVENT. Each BAdI implementation has to define the filter, which is also used for determining explicit calls of the BAdI for processing of notification. Default BAdI implementation used for notification has an initial BAdI ID.
- Alert notification – determines the period for sending notifications. Possible values are:
- At first occurrence – notifies when an alert occurs for the first time
- At next occurrence – notifies each occurrence of an alert
- At end of alert – notifies when an alert is completed
You might find some examples of email notifications in the chapter (DI-2205) Set up Alerts.